A hands-on, step-by-step guide to installing Prometheus Operator and writing a ServiceMonitor on K3s.
What is Prometheus
Prometheus is a time-series metrics system that works on a "pull" model — Prometheus itself is the one that reaches out to an HTTP endpoint (usually /metrics) on each app on a fixed schedule (the opposite of a "push" system, where the app sends data in on its own), then stores what it collects along with labels in its own database so you can query it later with PromQL.
Because Prometheus is the one pulling data, it has to know in advance where to pull from. These destinations are called targets — with vanilla Prometheus, you'd have to hand-write the target list into prometheus.yml and reload it every time a new service showed up in the cluster. Prometheus Operator solves this with a simple idea: "whatever app already exposes a metrics endpoint just announces itself to Prometheus through an object called ServiceMonitor," and Prometheus will go find it on its own.
1. How Prometheus Operator Actually Works
The Operator is a controller that runs this loop continuously:
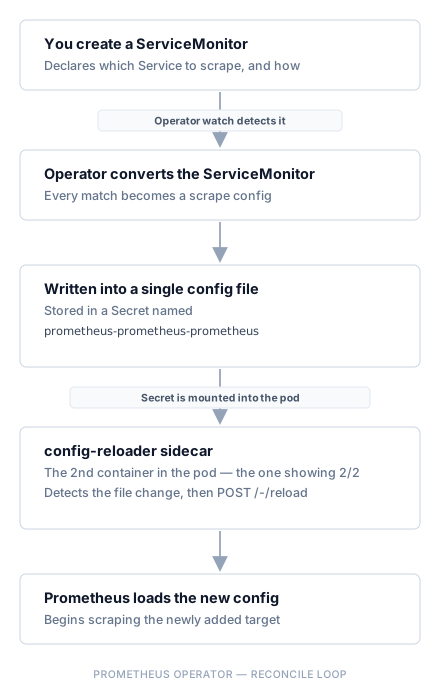
The short version: you never edit Prometheus's config directly, not even once. What you do instead is create/edit a Kubernetes object (ServiceMonitor), and let the Operator + config-reloader handle the entire pipeline for you. This is the single CRD you'll touch the most in day-to-day work. The Prometheus CRD itself (capitalized — that's the CRD name) usually already ships with a sensible default from install time, so you don't need to create it yourself — and it has three siblings for special cases (see section 5).
Prometheus (CRD) — Already Provided, No Need to Create It Yourself
Besides ServiceMonitor, the Operator also manages another CRD called Prometheus (capitalized = the CRD name, not the binary). Its job is to declare what kind of Prometheus server you want — how many replicas, how many days of retention, how much resource to allocate, and most importantly for this article, which ServiceMonitors it should even look at (serviceMonitorSelector). Once you finish the install in the next section, the script will already have created this CR for you — no need to write it by hand.
2. Installing Prometheus via the Operator
Install it through the Helm chart kube-prometheus-stack, which brings in several components together in the monitoring namespace: Prometheus Operator (the controller that turns Custom Resources into config), Prometheus and Alertmanager (created via CRDs of the same name), plus Grafana, kube-state-metrics, and node-exporter.
We use helm template to render the manifest first, then kubectl apply --server-side --force-conflicts (--server-side tells the API server who owns each field for a safer merge than plain apply, and --force-conflicts lets us take over field ownership from whatever field manager already claimed it — necessary because some fields are already touched by another webhook/controller) instead of running helm install directly — so we can inspect/control the YAML before it's applied, and so it fits a GitOps workflow.
The values file, example YAML, and every script this article refers to from here on are collected at prometheus-demo — you can clone it and use it directly instead of copy-pasting each file yourself:
git clone https://github.com/devops-skill-experts/prometheus-demo.git
cd prometheus-demo
The actual prometheus-values.yaml we use (with the parts of Grafana unrelated to ServiceMonitor trimmed out, like the dashboard sidecar and custom subpath — but keeping the credentials section and the disabled test hook) — matches the prometheus-values.yaml file in the repo:
prometheus-values.yaml
fullnameOverride: prometheus

grafana:
  admin:
    existingSecret: "grafana-credentials"
    userKey: GRAFANA_USER
    passwordKey: GRAFANA_PASSWORD
  testFramework:
    enabled: false

prometheus:
  prometheusSpec:
    serviceMonitorNamespaceSelector: {}
    serviceMonitorSelector: {}
If you already cloned the repo and this file is ready to go, no need to create it yourself — but if you'd rather copy-paste it, save the content above into a file named prometheus-values.yaml in the folder you'll run the next commands from. Every step below references this file via -f prometheus-values.yaml.
grafana.admin.existingSecret above refers to a Secret named grafana-credentials that you need to create yourself first (step 2 below) — this file:
grafana-secret.yaml
apiVersion: v1
kind: Secret
metadata:
  name: grafana-credentials
  namespace: monitoring
type: Opaque
stringData:
  GRAFANA_USER: admin
  GRAFANA_PASSWORD: changeme123
Change GRAFANA_USER/GRAFANA_PASSWORD to whatever you actually want before applying (the values in the file are just an example — do not use them for real). We use stringData instead of data so you can type plain text directly, no need to base64-encode it yourself. If you cloned the repo, this file already exists too (named grafana-secret.yaml).
Follow the steps below in the same terminal, back to back, all the way through step 8 (don't close or switch windows yet), because step 5 defines a render() function that steps 6 and 8 both call. If you open a new terminal partway through, this function disappears with it. Each block below is a separate command — run them one at a time, in order, and don't skip any.
Step 1 — create the namespace
kubectl apply -f - <<EOF
apiVersion: v1
kind: Namespace
metadata:
  name: monitoring
EOF
Step 2 — create the Grafana credentials secret
kubectl apply -f grafana-secret.yaml
You need to change
GRAFANA_USER/GRAFANA_PASSWORDin the file to whatever you want before running this line (see details above) — themonitoringnamespace must already exist from step 1, otherwise apply will fail because it can't find the namespace.
Step 3 — add the Helm repo
helm repo add prometheus-community https://prometheus-community.github.io/helm-charts
Step 4 — update the Helm repo
helm repo update
Step 5 — define the install function
render() {
  helm template kube-prometheus-crds prometheus-community/kube-prometheus-stack \
    --version 76.4.0 --include-crds --namespace monitoring -f prometheus-values.yaml
}
This command just defines a function called
renderand keeps it in the terminal — it doesn't touch the cluster yet. It'll run with no output at all, which is normal. Move on to step 6.
Step 6 — first apply
render | kubectl apply -f - --server-side --force-conflicts
Expect over 40 lines of errors like this — this is normal, nothing is broken:
resource mapping not found for name: "prometheus-prometheus" ... kind "Prometheus"
ensure CRDs are installed first
The cause is that CRDs like
ServiceMonitorandPrometheushaven't been created in the cluster yet at the time of this first apply, so objects that reference those CRDs fail to apply. Move on to step 7 — thehelm templatecommand was pulled out into the shell functionrenderback in step 5 specifically for this reason: if you ever need to change--versionor the values filename later, you only have to fix it in one place instead of chasing down two spots and risking a mismatch.
Step 7 — wait for the CRDs to really be ready
kubectl wait --for condition=established --timeout=90s \
  crd/servicemonitors.monitoring.coreos.com crd/prometheuses.monitoring.coreos.com
Step 8 — apply again
render | kubectl apply -f - --server-side --force-conflicts
kubectl waitin step 7 waits until the CRDs are actually registered before we apply a second time (instead of guessing with a fixedsleep, which would break on a slower cluster). Therender()called here is the same one defined in step 5 — if the terminal got closed, you'll need to redefine it before running this line (copy the command from step 5 and paste it in first).
Or, if you already cloned the example repo, skip all 8 steps above and run this single command instead (it does everything, including applying the Secret):
bash 01-install.bash
Don't forget to change
GRAFANA_USER/GRAFANA_PASSWORDingrafana-secret.yamlbefore running01-install.bashtoo, or you'll ship the insecure example credentials along with it.
Check that the install succeeded:
Runs immediately
kubectl get pods -n monitoring
Actual output
NAME                                                       READY   STATUS    RESTARTS   AGE
alertmanager-prometheus-alertmanager-0                     2/2     Running   0          105s
kube-prometheus-crds-grafana-85778c7d-pbkqd                3/3     Running   0          2m11s
kube-prometheus-crds-kube-state-metrics-68885d944c-d75ls   1/1     Running   0          2m11s
kube-prometheus-crds-prometheus-node-exporter-6kmps        1/1     Running   0          2m11s
prometheus-operator-6dd594b9db-tvtv6                       1/1     Running   0          2m11s
prometheus-prometheus-prometheus-0                         2/2     Running   0          103s
Each pod plays a different role:
| Component | Role |
|---|---|
prometheus-operator |
controller that turns Custom Resources into config for Prometheus |
prometheus-prometheus-prometheus-0 |
the actual Prometheus server that stores metrics and answers queries |
alertmanager-prometheus-alertmanager-0 |
receives alerts from Prometheus and routes them onward (email/Slack/etc.) |
*-grafana |
dashboard UI, auto-connected to Prometheus as a datasource |
*-kube-state-metrics |
turns the state of K8s objects (Deployment, Pod, etc.) into metrics |
*-prometheus-node-exporter |
machine-level metrics (CPU, memory, disk) for each node |
Notice the Prometheus pod shows 2/2, not 1/1 — the second container is the config-reloader sidecar, as described in the diagram in the previous section.
A note on naming:
kube-prometheus-crdsin the commands above is just the Helm release name used in this example — it doesn't mean only the CRDs got installed (this name will show up again as a label in section 3 — if it's confusing, just read it as "the release name," you can call it whatever you like).fullnameOverride: prometheusin the values file only affects resources from the main chart (so the Prometheus CR is namedprometheus-prometheus, the Secret is namedprometheus-prometheus-prometheus), but it doesn't propagate to subcharts — so Grafana and kube-state-metrics still use the release name as their prefix (kube-prometheus-crds-*). If you see both naming styles mixed together in this article, that's why.
Verify that the Prometheus CRD's CR that the script created actually exists (as mentioned in the previous section):
Runs immediately
kubectl get prometheus -n monitoring
The name prometheus-prometheus you'll see in the output comes from the fullnameOverride: prometheus set above, and it'll come up again several times in section 3 while we trace the bug — worth remembering now.
3. Making the ServiceMonitor Actually Scrape, and Debugging It When It Doesn't
This article uses the Redis exporter as a test target, which follows the exact same approach as the Logstash exporter — you just swap out which exporter it points to. Install Redis (Bitnami chart) with metrics turned on, following the steps below in the same terminal where render() from section 2 is still defined (or any terminal, if you're done needing render() from here on):
Step 1 — create the namespace
kubectl create namespace redis-demo
Step 2 — add the Bitnami Helm repo
helm repo add bitnami https://charts.bitnami.com/bitnami
Step 3 — update the Helm repo
helm repo update
Step 4 — install Redis with metrics enabled
helm install redis-demo bitnami/redis -n redis-demo \
  --set architecture=standalone \
  --set auth.enabled=false \
  --set metrics.enabled=true \
  --set metrics.serviceMonitor.enabled=true \
  --set metrics.serviceMonitor.namespace=redis-demo \
  --set image.repository=bitnamilegacy/redis \
  --set metrics.image.repository=bitnamilegacy/redis-exporter \
  --set volumePermissions.image.repository=bitnamilegacy/os-shell
Note:
auth.enabled=falseis for the demo only — never set this in production.bitnamilegacy/*is genuinely required for this test to work (not "might be needed") because since late August 2025, Bitnami moved its free public images to this legacy registry. The chart will warn "Substituted images detected," but the deploy still goes through fine. The command above was tested successfully on 2026-08-13 — if you're running this well after that date, check the chart README again to see if the same flags are still required.
Or, if you already cloned the example repo, run this single command instead:
bash 02-install-redis-exporter.bash
The chart will automatically create a ServiceMonitor that looks like this (equivalent to what you'd have to write by hand if the app wasn't already shipped with a Helm chart — this file also exists in the example repo as servicemonitor-example.yaml):
Example ServiceMonitor
apiVersion: monitoring.coreos.com/v1
kind: ServiceMonitor
metadata:
  name: redis-demo
  namespace: redis-demo
spec:
  endpoints:
  - port: http-metrics
    interval: 30s
  namespaceSelector:
    matchNames:
    - redis-demo
  selector:
    matchLabels:
      app.kubernetes.io/component: metrics
      app.kubernetes.io/instance: redis-demo
      app.kubernetes.io/name: redis
The single most common trap:
endpoints[].portis the port name declared in the Service (spec.ports[].name), not the port number. In this example, theredis-demo-metricsService hasports: [{name: http-metrics, port: 9121}], so you have to writeport: http-metricsto match the name, notport: 9121. If you want to specify it as a number, use thetargetPortkey instead — though it's not recommended, since it's more fragile.To sum up the whole matching chain:
ServiceMonitor.spec.selector→ finds the Service with matching labels →endpoints[].porthas to match the port name declared in that Service.
Opening the Prometheus UI
The Prometheus that the chart installs is not exposed outside the cluster. The fastest way in is port-forward:
Runs immediately
kubectl port-forward svc/prometheus-prometheus -n monitoring 9090:9090
This command hangs there with no "done" message to look at once it's running — that's normal, and don't hit Ctrl+C to close it, because that stops the forwarding immediately. Leave it running the whole time you're using the UI/queries.
Open a separate terminal window (e.g. another Git Bash or PowerShell window/tab) and
cdback to the same folder that hasprometheus-values.yaml. Runcurl,kubectl get, and every other command left in this article from this new window — leave the original window runningkubectl port-forwardalone in the background.
Then open http://localhost:9090 and you'll find the query box along with the Status menu, which holds every diagnostic page — the two you'll use most in this article are Status → Targets (what Prometheus is currently scraping, and its status) and Status → Service Discovery (what targets it found, and what the labels look like after relabeling).
The Prometheus UI screenshots in this article were taken from a test cluster whose UI looks identical to any other — the IPs and outputs referenced throughout come from testing on a real K3s cluster, as described.
Open Targets and Find Nothing — No Errors Either
Open Status → Targets as described above. You'd expect to see a target for redis-demo show up — but there's nothing, even though kubectl get servicemonitor redis-demo -n redis-demo confirms the object was created successfully, and the Service's endpoint has a real IP ready to be scraped.
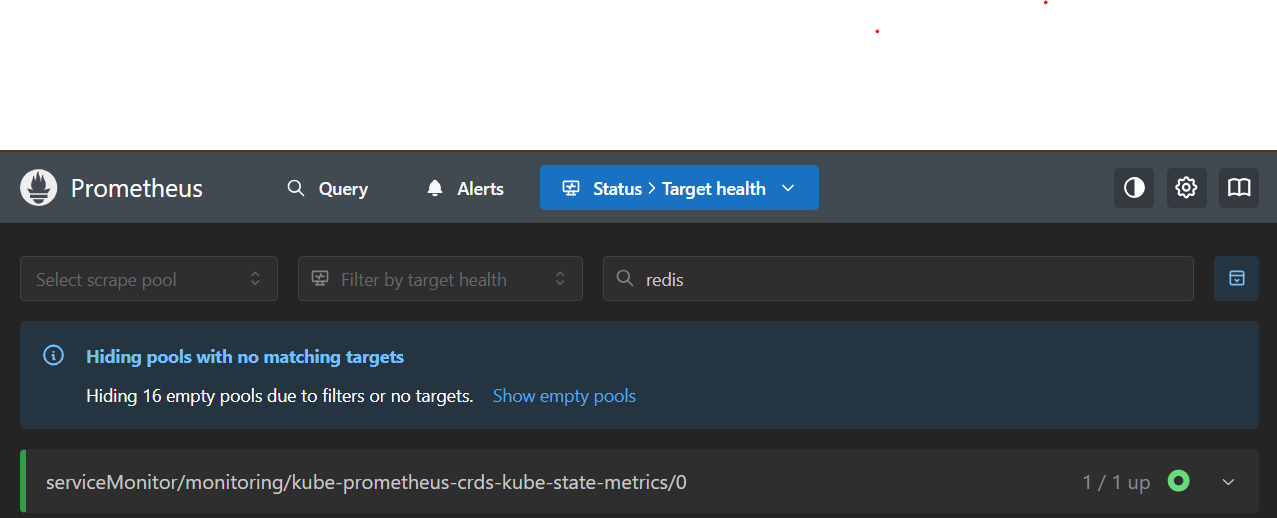
This is where people lose the most time hunting for the cause, because there's no error message anywhere to look at. Here's the debugging order that actually works, from fastest/most on-point to least:
1) Check exactly what condition Prometheus is using to select ServiceMonitors (the command that finds the cause)
kubectl get prometheus prometheus-prometheus -n monitoring \
  -o jsonpath='{.spec.serviceMonitorSelector}{"\n"}{.spec.serviceMonitorNamespaceSelector}'
❌ actual output (while still broken)
{"matchLabels":{"release":"kube-prometheus-crds"}}
{}
2) Check from the UI — and understand why it doesn't complain at all
Status → Service Discovery lists every scrape pool the Operator has created config for — but for this specific kind of bug (where the ServiceMonitor gets cut out at the Prometheus CR level, not just at the Service/Endpoint label level), this page won't even show an entry for redis-demo, not "there but marked dropped with a reason" — because the Operator never turned this ServiceMonitor into a scrape config in the first place, so there's nothing to list on this page at all:
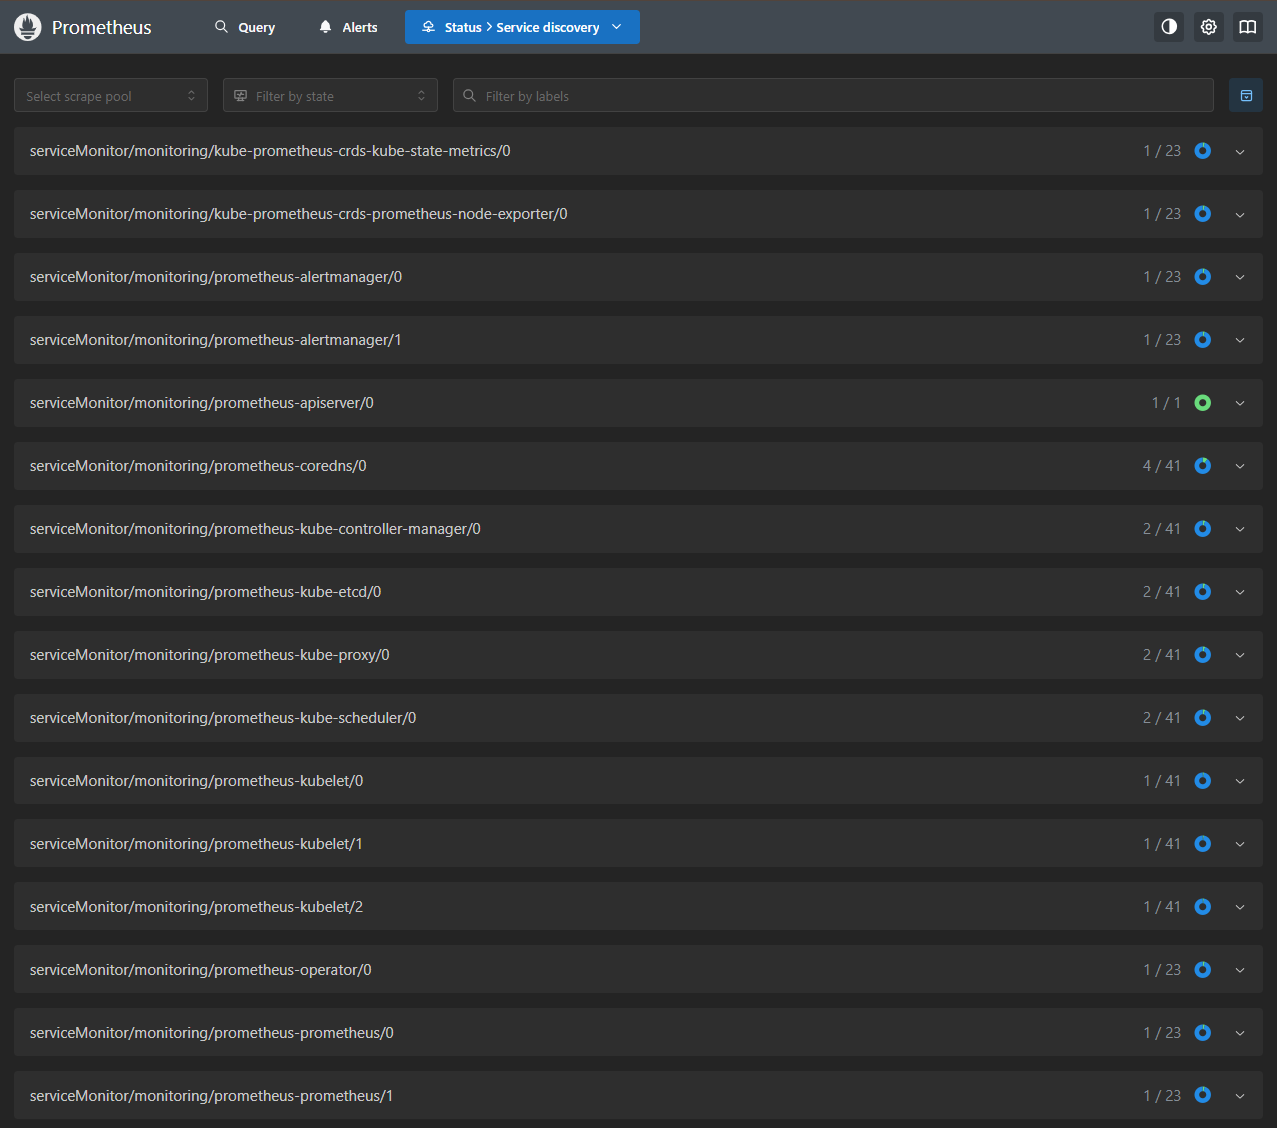 Notice that no line mentions
 redis-demo at all — unlike the case where Service/Endpoint labels simply don't match, where you'd normally still see an entry show up along with a reason for why it got dropped
If you go through the whole list and never find your ServiceMonitor's name in there, suspect the CR-level serviceMonitorSelector first (the command above) rather than going through each Service's labels one by one.
3) Confirm whether the actual scrape config Prometheus is using has our job in it
MSYS_NO_PATHCONV=1 kubectl exec -n monitoring prometheus-prometheus-prometheus-0 -c prometheus -- grep -A5 redis-demo /etc/prometheus/config_out/prometheus.env.yaml
This command reads the actual config file Prometheus is using directly from inside the container (
grepruns inside the container, not on your local machine), so it works on macOS, Linux, and Windows without installing anything extra besides thekubectlyou already have.MSYS_NO_PATHCONV=1in front is only needed on Windows Git Bash (to stop the/etc/prometheus/...path from being auto-converted into a Windows path) — on macOS/Linux it has no effect, no need to strip it out.
❌ actual result at this point (while still broken): the terminal prints nothing at all, and ends with
command terminated with exit code 1— this is the correct result, not a broken command.grepreturns exit code 1 when it can't find the string you gave it, which lines up exactly with what we're chasing here:redis-demogenuinely isn't in Prometheus's actual config yet, matching what we found in points 1 and 2 above.
The Real Cause
The actual serviceMonitorSelector value we see (matchLabels: {release: kube-prometheus-crds}) doesn't match what we set in values ({}) at all — because the kube-prometheus-stack chart's template is written roughly like this:
Actual chart template structure (abbreviated)
{{- if .Values.prometheus.prometheusSpec.serviceMonitorSelector }}
  serviceMonitorSelector: {{ toYaml .Values.prometheus.prometheusSpec.serviceMonitorSelector }}
{{- else if .Values.prometheus.prometheusSpec.serviceMonitorSelectorNilUsesHelmValues }}
  serviceMonitorSelector:
    matchLabels:
      release: {{ .Release.Name }}
{{- else }}
  serviceMonitorSelector: {}
{{- end }}
In Go templates, an empty map value {} is treated as falsy. So the first if condition doesn't pass, and it falls through to serviceMonitorSelectorNilUsesHelmValues: true (the chart's default value) immediately. The result is matchLabels: {release: <helm-release-name>} instead of the empty value we intended. In short, writing serviceMonitorSelector: {} in values is no different from not writing it at all, as long as NilUsesHelmValues hasn't also been turned off.
Note: another trap sitting right next to it that gets mixed up often —
serviceMonitorNamespaceSelector(which controls whether other namespaces get looked at) has the opposite semantics fromserviceMonitorSelector:
- Not set at all (null) = only see ServiceMonitors in the same namespace as Prometheus.
- Set to
{}= see every namespace.That's the opposite of
serviceMonitorSelector, where{}does not actually mean "everything" as long asNilUsesHelmValuesis stilltrue. These two look nearly identical but behave completely differently — remember this pair and you won't get confused by it again.
The Fix — Fix It in values, Not by Patching Labels One by One
The recommended approach: turn off NilUsesHelmValues in values.yaml so that {} actually has the effect it's supposed to (do it once, and it covers every ServiceMonitor going forward, including ones other Helm charts create automatically):
Add these lines into the existing prometheusSpec
    serviceMonitorSelectorNilUsesHelmValues: false
    podMonitorSelectorNilUsesHelmValues: false
    ruleSelectorNilUsesHelmValues: false
    probeSelectorNilUsesHelmValues: false
    scrapeConfigSelectorNilUsesHelmValues: false
Append this right after the existing serviceMonitorSelector: {} in the file (see the full version at the end of this section — if you copy this block over the whole file without keeping the existing fullnameOverride and selector, you'll get an entirely new set of resource names and every command from before this point will stop working), then run the two commands below in order — this time, one pass is enough, because the CRDs are already installed from section 2:
Note: if you opened a new terminal to get to this point (e.g. you closed the old one while checking the UI), the
render()function defined in section 2 will have disappeared too — the first block below redefines it for you, no need to go back and copy it from section 2.
render() {
  helm template kube-prometheus-crds prometheus-community/kube-prometheus-stack \
    --version 76.4.0 --include-crds --namespace monitoring -f prometheus-values.yaml
}
render | kubectl apply -f - --server-side --force-conflicts
Fallback option — if you genuinely can't touch the shared chart values.yaml, patch labels onto each ServiceMonitor individually instead (the downside is you have to remember to do this every time there's a new ServiceMonitor, including ones other charts create automatically for you, which goes against this article's whole point of "nothing extra to configure" — use this only as a temporary fix):
Runs immediately (fallback option)
kubectl label servicemonitor redis-demo -n redis-demo release=kube-prometheus-crds
Confirming Success
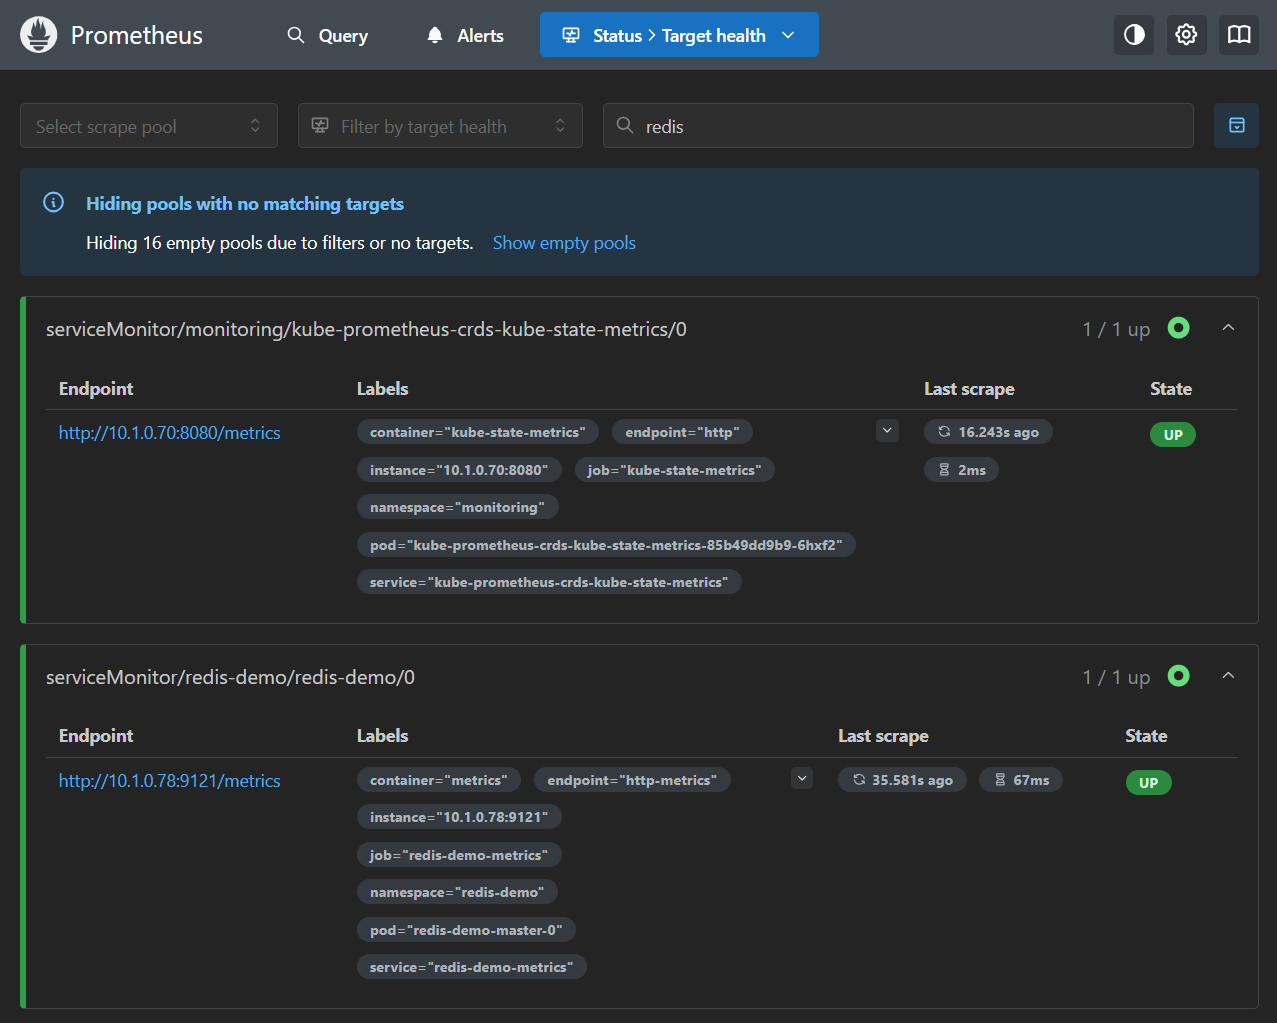
Runs immediately
curl -s 'http://localhost:9090/api/v1/query?query=redis_up'
✅ actual output (reformatted here for readability — the raw
curlresponse comes back as one line, since this article intentionally never pipes throughjqor any other JSON parser, so every command here runs immediately on macOS/Linux/Windows without installing anything beyondcurl, which you already have. Look at the last value in"value"— if it's"1", the target is UP.){ "status": "success", "data": { "resultType": "vector", "result": [ { "metric": { "__name__": "redis_up", "container": "metrics", "endpoint": "http-metrics", "instance": "10.42.0.17:9121", "job": "redis-demo-metrics", "namespace": "redis-demo", "pod": "redis-demo-master-0", "service": "redis-demo-metrics" }, "value": [1784640090.989, "1"] } ] } }
The complete prometheus-values.yaml after the fix (combining section 2's content with this section's fix in one place, ready to use as-is):
prometheus-values.yaml (final version)
fullnameOverride: prometheus
grafana:
admin:
existingSecret: "grafana-credentials"
userKey: GRAFANA_USER
passwordKey: GRAFANA_PASSWORD
testFramework:
enabled: false
prometheus:
prometheusSpec:
serviceMonitorNamespaceSelector: {}
serviceMonitorSelector: {}
serviceMonitorSelectorNilUsesHelmValues: false
podMonitorSelectorNilUsesHelmValues: false
ruleSelectorNilUsesHelmValues: false
probeSelectorNilUsesHelmValues: false
scrapeConfigSelectorNilUsesHelmValues: false
4. Querying Real Metrics with PromQL
Test a query through the Prometheus HTTP API directly (same output you'd get typing into the UI and hitting Execute → the Table tab):
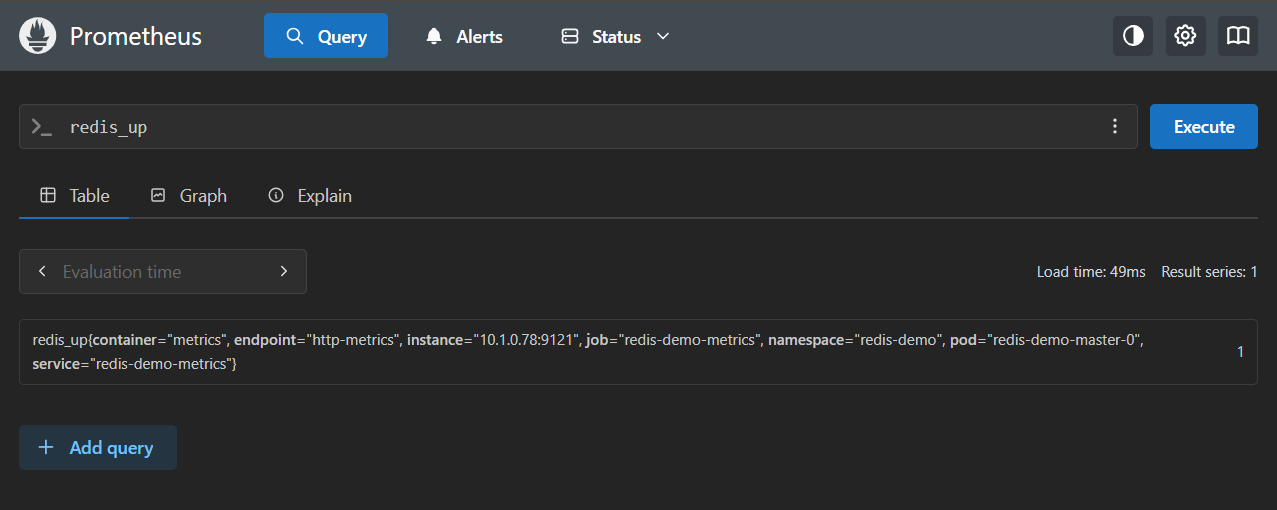
This is the same query we just used to confirm success in the previous section — now let's look at what each part of the output actually means:
Runs immediately
curl -s 'http://localhost:9090/api/v1/query?query=redis_up'
Actual output (reformatted here for readability — still just the raw curl response, since we're not piping through jq) — the structure reads left to right roughly like this: status/resultType tell you whether the query succeeded and what shape of result it got, while inside result[0], metric holds all the labels for this target, and value is [timestamp, the measured value].
{
  "status": "success",
  "data": {
    "resultType": "vector",
    "result": [
      {
        "metric": {
          "__name__": "redis_up",
          "container": "metrics",
          "endpoint": "http-metrics",
          "instance": "10.42.0.17:9121",
          "job": "redis-demo-metrics",
          "namespace": "redis-demo",
          "pod": "redis-demo-master-0",
          "service": "redis-demo-metrics"
        },
        "value": [1784640090.989, "1"]
      }
    ]
  }
}
Other metrics from the same exporter (actual values pulled during this test):
| Metric | Actual value |
|---|---|
redis_up |
1 |
redis_connected_clients |
1 |
redis_commands_processed_total |
374 |
redis_uptime_in_seconds |
775 |
If you want throughput expressed per second, wrap the counter in rate():
Runs immediately
curl -sg 'http://localhost:9090/api/v1/query?query=rate(redis_commands_processed_total[5m])'
Note: always include the
-gflag (globoff) here whenever a URL contains[...]. By default,curltries to interpret[...]/{...}in a URL as a pattern for fetching multiple files at once (URL globbing), which silently breaks a query containing[5m]like this one — no error, just an empty result instead.-gturns this behavior off, so[5m]gets interpreted literally, the way PromQL needs it.
rate()itself needs a window at least ~4x wider than the scrape interval to get a value stable enough to trust (the interval in this example is30s, so the window should be[2m]or wider —[5m]in the example is safely above that). If scraping has only succeeded for a few minutes so far, you might get an empty result at first, because there aren't enough data points yet to compute a rate of change.
These metrics get scraped into the same Prometheus instance that Grafana (which was installed alongside it back in section 2) is already auto-connected to as a datasource — you can start building a dashboard on top of it right away without any extra setup. Log into Grafana with the username/password you set yourself in grafana-secret.yaml back in section 2 (no need to pull a randomly generated password out of a Secret like the chart's default, since this article sets it yourself via grafana.admin.existingSecret instead).
If you want to get alerted whenever redis_up hits 0, write it as a PrometheusRule — another CRD the Operator manages, following the exact same pattern as ServiceMonitor.
5. A Few More Things to Know Before Using This in Production
- What about an app that wasn't deployed with a Helm chart that creates a ServiceMonitor for you? — write the ServiceMonitor yourself, following the example in section 3. Just point
selector.matchLabelsat your Service's own labels, and make sureendpoints[].portmatches the port name exposing/metrics. - No Service to point at (e.g. scraping straight from a Pod, or a target that isn't a k8s object at all)? — there are sibling CRDs to ServiceMonitor for this:
PodMonitor(points straight at a Pod),Probe(for blackbox exporter),ScrapeConfig(static/most flexible config). All of them are controlled by a selector following the exact same pattern asserviceMonitorSelectorin this article (there's a matchingpodMonitorSelectorNilUsesHelmValues, etc. for each one). - Data lost on pod restart — kube-prometheus-stack's defaults don't attach a PersistentVolume to Prometheus unless you set
prometheus.prometheusSpec.storageSpecyourself. All metric data gets wiped whenever the pod restarts or moves to another node — this usually surfaces a week later, when you want to query historical data and it's just gone. K3s already ships with a StorageClass calledlocal-pathas the default, which you can turn on easily like this:
prometheus:
  prometheusSpec:
    storageSpec:
      volumeClaimTemplate:
        spec:
          storageClassName: local-path
          resources:
            requests:
              storage: 10Gi
Further reading: all example code/scripts from this article · the actual monitoring stack install script used in production · Prometheus Operator API Reference · full kube-prometheus-stack values.yaml
Summary
- Install Prometheus once through the Operator, and you get Prometheus, Alertmanager, and Grafana together in one shot.
- Adding a new target = create a
ServiceMonitorpointing at a Service that's already exposing metrics —endpoints[].porthas to be the port's name, not a number. - Before trusting that
selector: {}in values means "everything," verify it for real withkubectl get prometheus <name> -o jsonpath='{.spec.serviceMonitorSelector}', because the chart's default can silently override it throughNilUsesHelmValues. - A ServiceMonitor that Prometheus can't see produces no error to look at at all — you have to actively hunt for it using the 3 commands/screens in section 3.
- Don't forget storage/retention before taking this to production — the default ships with no PVC.
DevHubs Team • Dev Hub